

LTCUSDTMean reversion
TradingView ↗Trades deviations from a rolling price distribution.
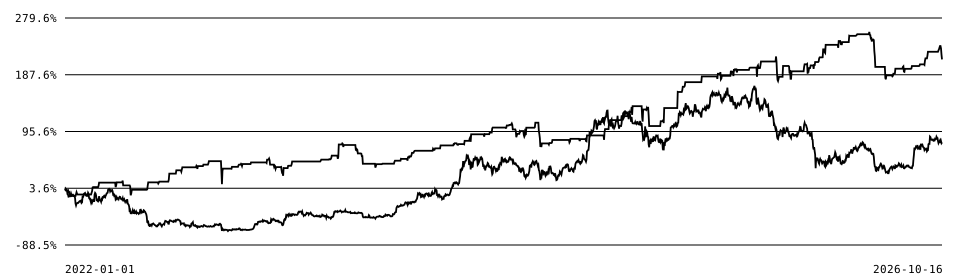
Cumulative return
Drawdown
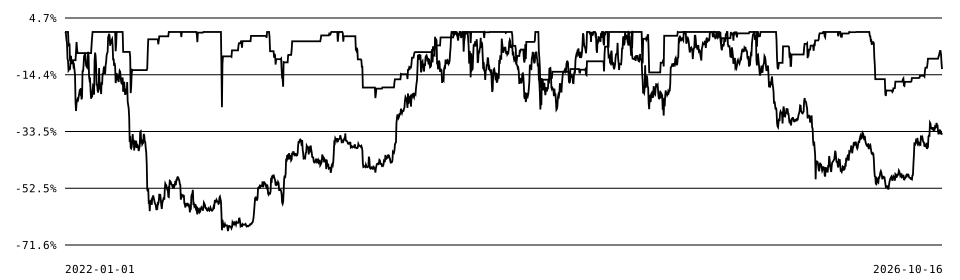
Daily observations. Headline Max Mark DD uses the full native-resolution PRO replay.
Strategy profile
- Direction
- Long
- BTC filter
- No
- Protective stop
- Trailing volatility-based
- Signal exit
- Yes
- Exit rules
- Signal / stop loss
- Position sizing
- Notional allocation
- Backtest start
- 2022-01-01
- Backtest end
- 2026-10-16 (exclusive)
- Closed positions
- 130
- Profitable trades
- 73.08%
- Best calendar month
- 17.99%
- Worst calendar month
- -17.50%
- Longest daily underwater spell
- 224 days
- Daily return volatility
- 1.51%
Monthly returns / %
Calendar-year performance
| Period | Strategy | BTC hold |
|---|---|---|
| 2022 | 42.87% | -64.22% |
| 2023 | 15.00% | 155.62% |
| 2024 | 30.26% | 121.29% |
| 2025 | 37.01% | -6.33% |
| 2026 | 6.56% | -6.18% |
First and last periods may be partial. Returns are not annualized.
Reading this report
Both curves begin at zero percent on the same effective start date. BTC is a spot buy-and-hold benchmark.
Profitable trades counts fully closed positions after costs and funding. It is not the percentage of positive days.
Different start dates describe different market histories; compare periods before comparing rankings.
Methodology & limitations
PRO pro-fast historical simulation. Closed-bar signals and next-open execution; fees, slippage and historical funding included. BTC spot benchmark includes entry costs and no perpetual funding. Account value is compounded continuously without annual resets.
Observed research periods are not untouched out-of-sample data. Active means currently in use; it does not establish safety or strategy quality. Daily analytics use QuantStats; headline financial metrics retain PRO evidence. Current instrument constraints are applied retrospectively. Leveraged simulations do not model exchange liquidation. Calculation cutoff: 2026-10-16, exclusive.